

- Summary — what did people say, in aggregate?
- Responses — what did this person say?
Summary
The Summary tab opens with five figures for the survey as a whole, then a card per question.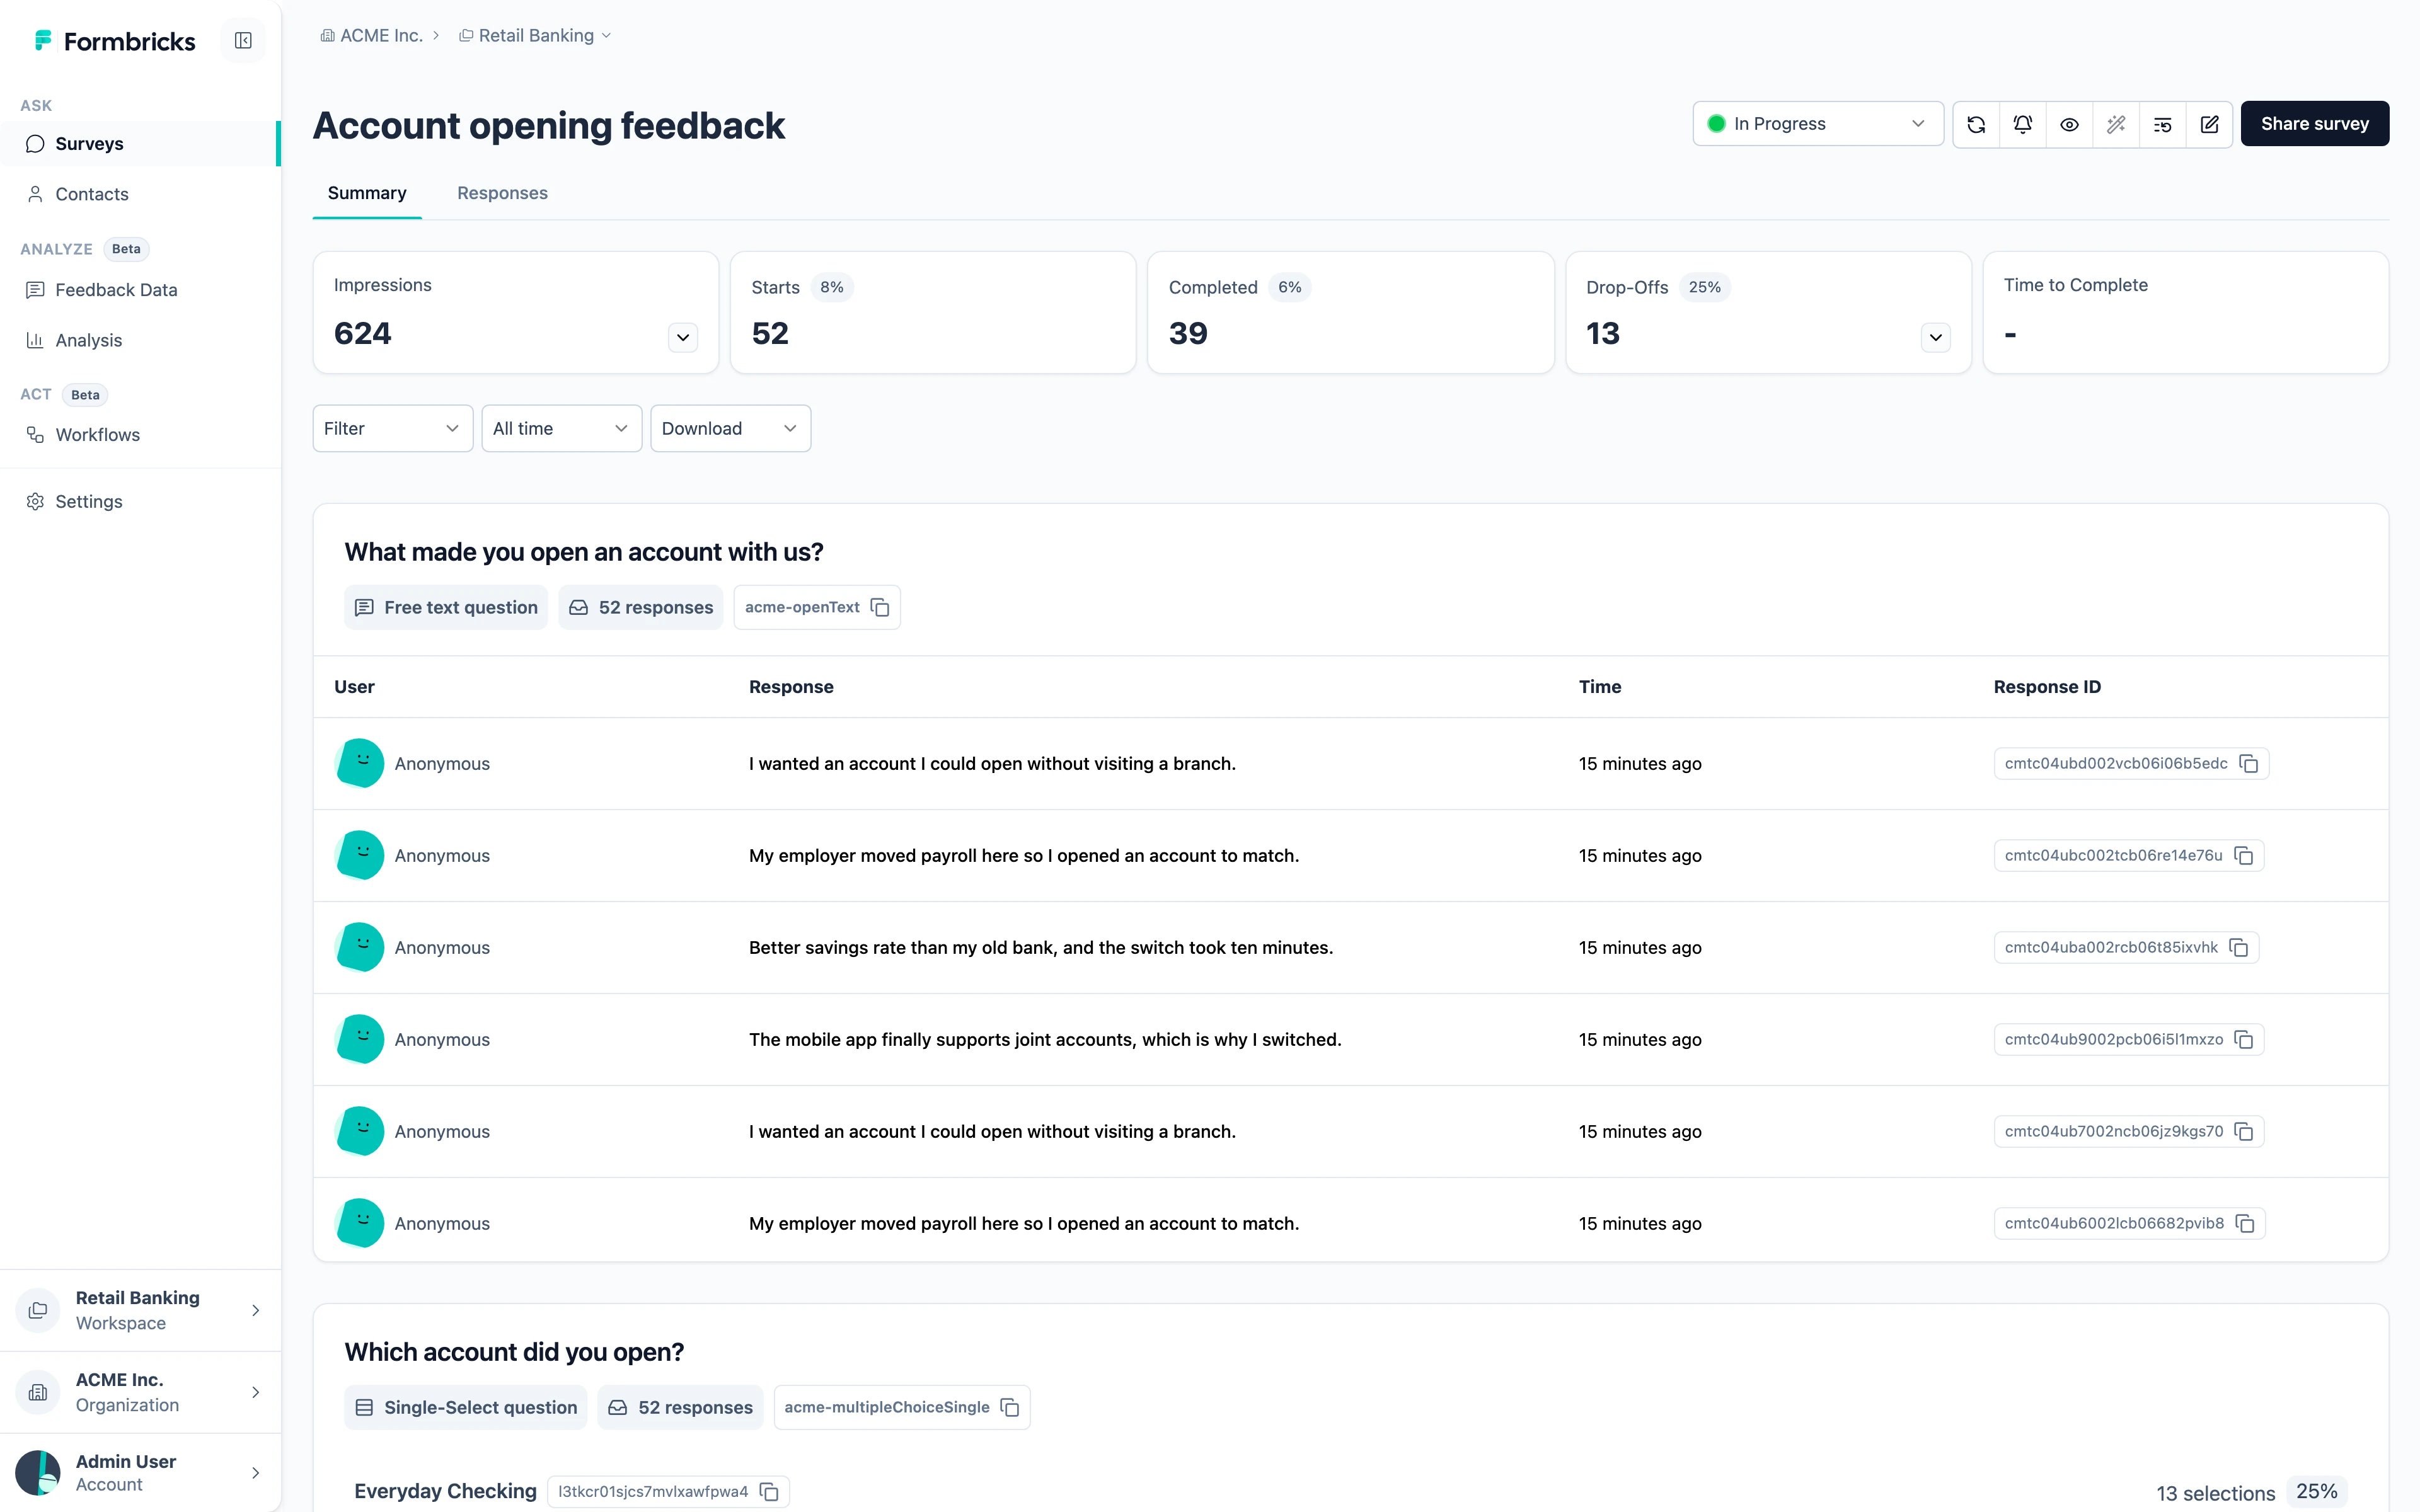
Below them, each question gets its own card in survey order. What the card shows depends on the question: open text lists individual answers, choice questions show each option with its share, and rating-style questions show the distribution.
Responses
The Responses tab is one row per submission, with a column per question.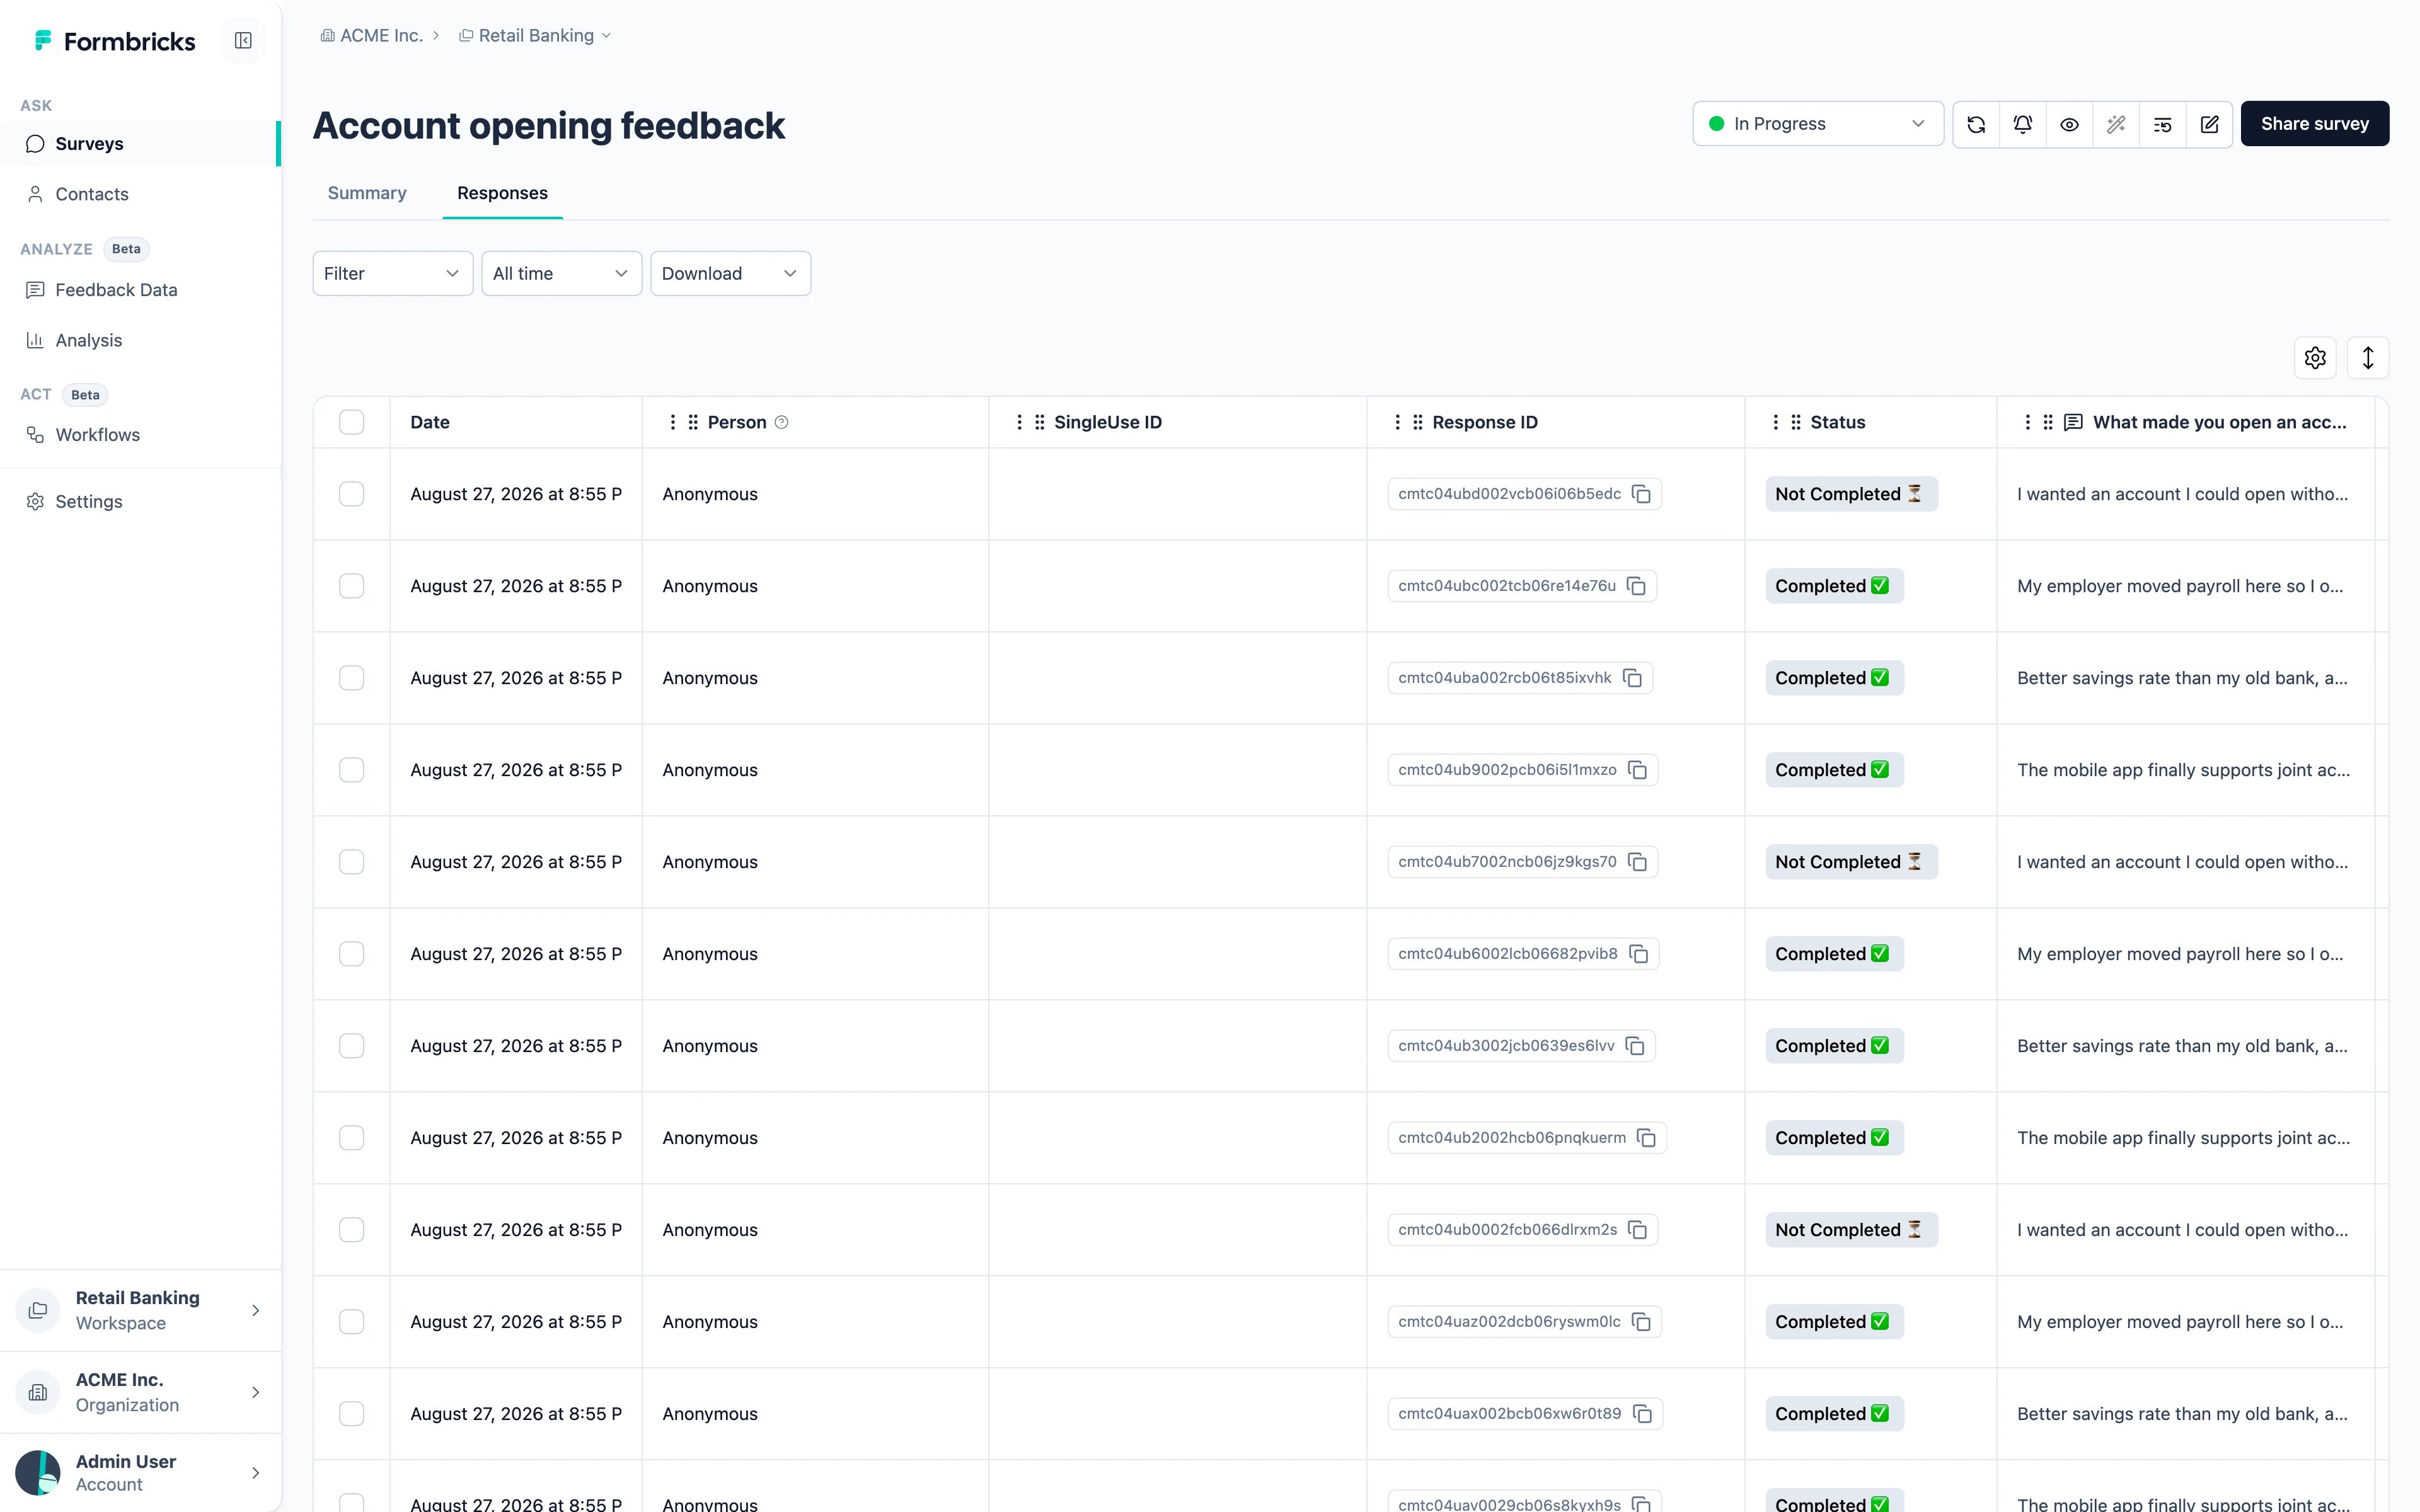
- Status — whether the response was completed or abandoned part-way.
- Person — the contact who answered, or Anonymous.
- Tags — any tags applied to the response.
- Hidden fields — values passed in with the survey rather than answered.
- Metadata — source, URL, browser, OS, device and country.
Filtering and exporting
Both tabs share the same Filter and time-range controls at the top, so a filter you set on the Summary carries to the Responses table. Filter on any answer, tag, hidden field or metadata value. Download offers three scopes, each as CSV or Excel:- All responses — everything, ignoring the current filter.
- Filtered responses — only what the current filter matches.
- Selected responses — only the rows you ticked in the table.