

Turn Unified Feedback Into Insights
Build charts in plain English or by hand. Pin them to dashboards.
Trend NPS, CSAT, and CES across every source.
Ask in English, refine by hand
Describe the chart you want. The AI builds the query, picks the right chart type, and renders it. Preview it, tweak it, and add it to a dashboard.
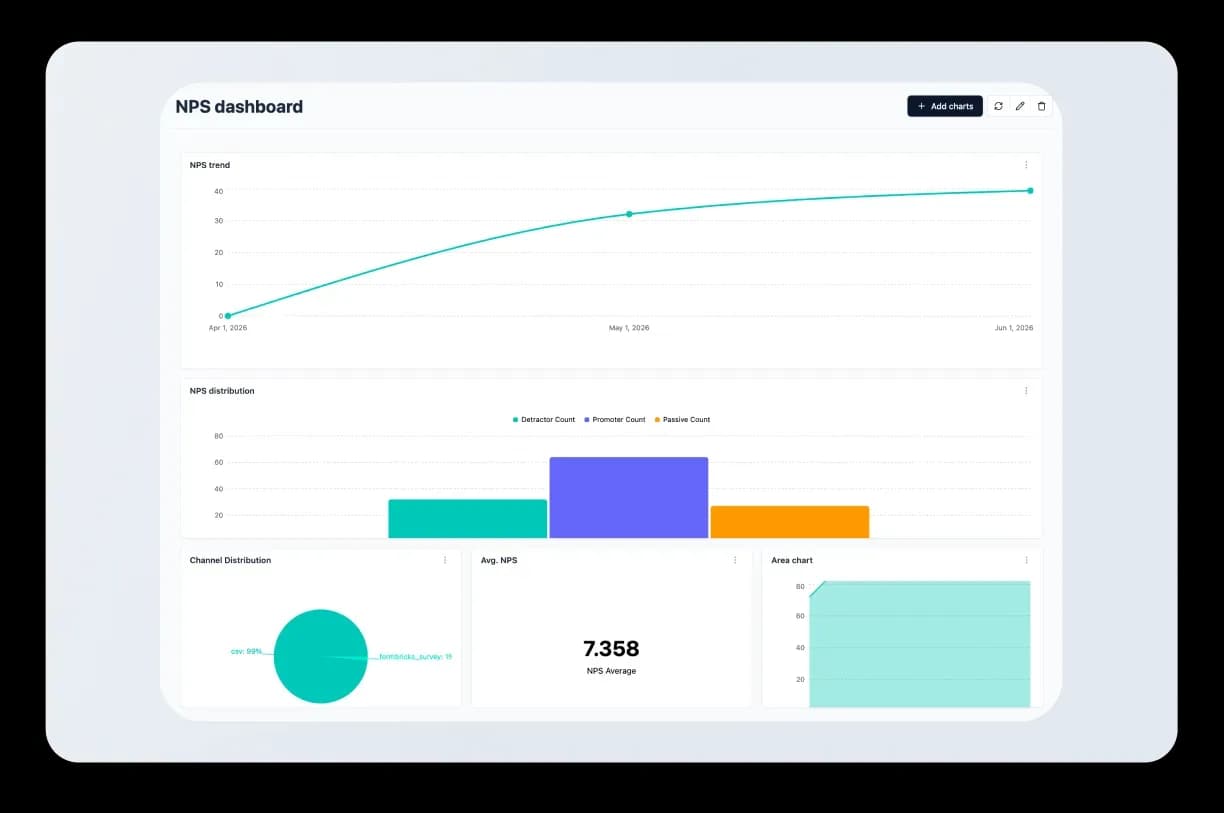
Analyze feedback from anywhere
Analyze feedback from surveys, CSVs, emails, Slack, and any other platform you use. All in one place, ready to visualize.
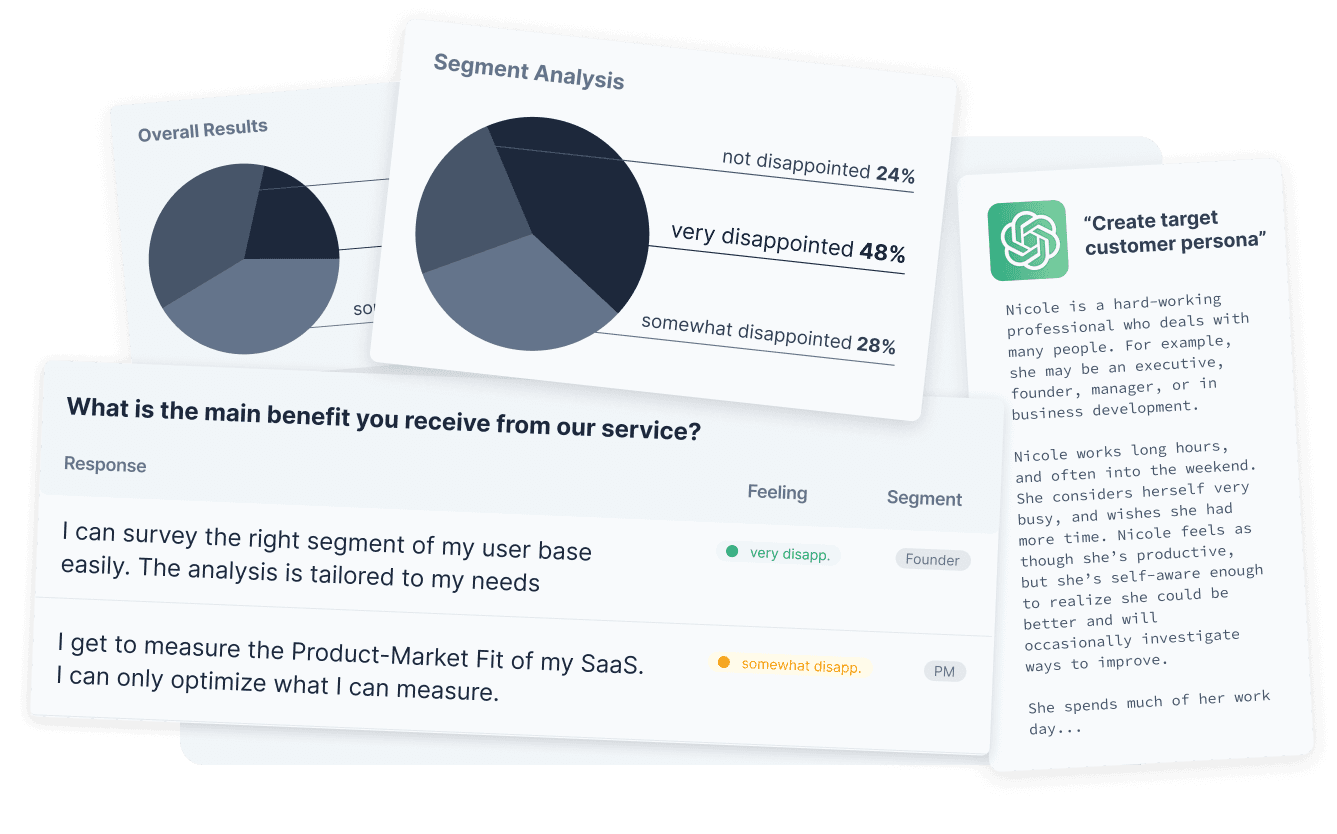
- 1
Pick a directory
- Description
- You only see what your workspace has access to.
- 2
Ask or build
- Description
- Type a request in plain English, or pick dimensions by hand.
- 3
Pin to a dashboard
- Description
- Arrange on a grid. Share with your team.
Chart types
Every chart, scoped to your directory
Area
Trend over time with magnitude.
Bar
Compare a measure across categories.
Line
Trend over time without fill.
Pie
Share of total for a small category set.
Big Number
Headline KPIs like total responses or average NPS®.
Live preview
Every chart updates as you tweak.
10,000+ teams at the world's best companies trust Formbricks






























Charts your team will actually open
Ask a question. Get a chart. Pin it. Share it.
FAQ